Halifax: It really is more than buses
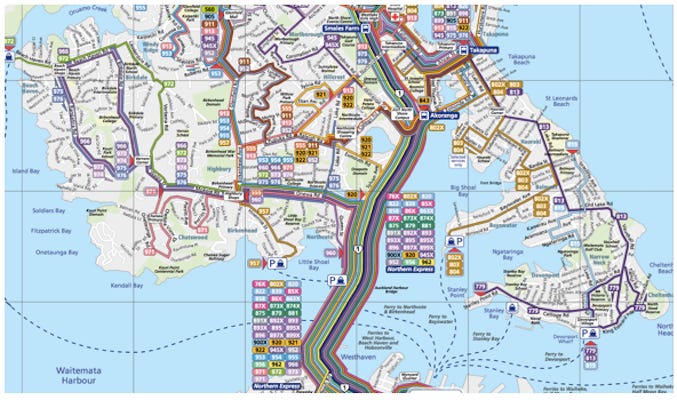
By Darren Davis. I was recently approached by the good folks at It’s More than Buses, a transit advocacy group in Halifax, Nova Scotia, Canada asking me to offer insights from Auckland’s public transit transformation known as the New Network that might be of benefit to Halifax as it proceeds to implement its Moving Forward Together plan to transform its transit system. Much official, public and stakeholder attention and money is focused on the shiny baubles of rail transit while the humble bus, often the workhorse or even sole mode of transit systems, gets the crumbs left over. [Why buses and bus network planning deserves much more attention will be the subject of a future post.] And Halifax just has the humble bus. A commuter rail system was studied a few years back but it was concluded that a system that delivered customers far from their final destinations might not be best, a mistake that took Auckland, New Zealand 73 years to fix once first identified. Halifax also has many of the things that make transit and overall transport planning in Auckland, New Zealand such a challenge. The MacDonald and MacKay bridges over the Halifax Harbour are obvious pinch points. Others geographic barriers include Nova Scotia’s 100-series expressway network around Halifax and the complete absence of a street grid outside of the Halifax Peninsula and Dartmouth on the Eastern Shore. This means that key arterial roads are often the only viable links between communities and have to provide for all modes. Auckland, New Zealand, has been through a journey similar to Halifax’s – aiming to transform public transit while recognizing the unlikelihood of significant boosts in funding. This means that more needs to be done to make the best of what is available. In the 1990s, Auckland had a breathtakingly huge 511 different routes and route variants in our system. The sheer number and complexity of the system meant transit riders only understood the particular trips they used, not the routes in their area, let alone the whole network. Through ongoing “routicide” we are down to 360 routes and will end up with 120 routes in our New Network without any significant changes in coverage but very significant improvements in frequency, simplicity, legibility and, most importantly, usability. We are confident from our past experience that the changes will yield positive results for transit riders . When Auckland implemented the New Network in Green Bay and Titirangi in 2014, as a test and phased implementation, we reduced route numbers from 24 to 9 and achieved a 35% increase in ridership within a year due to the New Network’s simple structure and consistent bus frequency. The network, route structure, and frequency of service meant buses pass each stop at the same times every hour (e.g., 10 minutes past the hour, 25 minutes past, and so on) every day of the week. Put simply, customers will use a network that they can simply grasp, and not one that causes them to scratch their heads. The way we achieved these successes is in part due to the size of the public transit fleet and how much of that fleet is used all-day and how much is just used in the peak. In industry parlance, this is known as the peak-to-base ratio and the closer you get to one, the more efficient your fleet utilization is. While that might sound dry and technical, the simple impact of a peak-to-base ratio nearer to one is more all-day service, which is useful for a range of trip purposes and not just the journey to work or school. And this means fewer buses spending large portions of their days sleeping at bus garages and more buses delivering service to customers. This has an obvious impact on operating costs – typically in Auckland it costs three times as much to run peak service as it does to run non-peak service. Effectively, non-peak service can be run at marginal cost because the cost of the bus is covered by the requirement to use it in the peak. Auckland’s transformation to a simple all-day network has been a long one and I have unflatteringly described our legacy bus network as spaghetti thrown at a map as you can see in the figure illustrating our legacy network.
Figure 1: Auckland’s legacy North Shore bus network. Map courtesy Auckland Transport
The legacy network shown is the current North Shore network and is focused on doing one thing and it does it well. It gets commuters to and from Downtown Auckland in the peak with 10,000 bus passengers crossing the Auckland Harbour Bridge in around 200 buses. However, this network sucks at doing everything else such as providing local service within the North Shore and non-peak service to Downtown Auckland. The peak-to-base ratio is up to four to one, meaning that three-quarters of the North Shore’s bus fleet spend their day at their depots, rather than providing service to customers. The alternative to the direct service approach is a connective network approach. The graphic below shows how connective networks can deliver up to 15 times the accessibility of direct service networks. This is because the connective network option in the example below gives access to five times as many destinations at three times the frequency (10 minute versus 30 minute frequency) for the same number of buses. On random arrival at stops, trips are nearly always faster on a connective network than on a direct service network, even where connections are involved. This is a powerful argument – for a similar amount of public money, you can get a vast improvement in mobility if people are prepared to connect. It puts the apparently intuitive logic of the one-seat ride to the test. If the only goal of your transit system is to get people to work downtown during the peak, then by all means the one-seat ride system is the way to go. But, if the aim of the transit system is to enable access to the whole of the city for a whole range of different purposes, then a connective network is the way to go.
Figure 2 : Direct Service vs Connective Service Model. Graphic courtesy Auckland Transport
When thinking about the right service model for transit in a community, there are some key questions:
Who are your current customers? It is crucial to understand your current customers and their needs.
Who are your potential customers (if the network worked better)?
What are the key travel patterns of current and potential customers? Often downtowns and universities are the key focus of current networks but travel patterns and destinations are much more diverse than this.
What is the mode share target for transit to reach? Transit is competing in a mobility marketplace for market share and should think like a business. How do we work to transit’s inherent strengths to make it work as best as possible?
What are the key pinch points for transit service and how do bus priority measures relate to these pinch points? Our experience in Auckland is that giving buses priority at pinch points where lots of traffic is stuck self-markets the benefits of public transit. For example, when Auckland implemented 4km of peak period bus lanes in 1998 on Dominion Road, one of our busiest bus routes, we achieved 20% year on year growth each year for four years for the price of paint and signs.
What is the coverage/ridership trade-off? This needs to be made explicit and requires an open conversation with the community. While ridership is a key goal of transit, transit also provides essential mobility for people who cannot or choose not to use other modes to access their homes, jobs, school, businesses, and all the places we travel to.
As a rule of thumb, service frequencies on the core routes in a network need to be high to generate all-day, every day ridership (at least every 15 minutes but preferably 10 minutes or better particularly on key corridors in the urban core) of the region – in the case of Halifax, the Halifax Peninsula and Dartmouth. Dedicating a lot of bus resources to express services to Downtown reduces the ability to focus resources on the high-ridership routes that generate the bulk of all-day ridership and allows better utilization of the bus fleet throughout the day. In Auckland, we are converting the “spaghetti thrown at a map” North Shore network to a rapid transit model shown below where much more local service feeds the Northern Busway with one-seat rides replaced by the busway rapid transit services doing the heavy lifting for the trip to Downtown Auckland. This strengthens both the busway and local service while using roughly the same amount of buses. Local communities benefit from much more frequent service than would otherwise have been possible and Downtown benefits by more frequent rapid transit service on the busway spine.
Figure 3: 2018 frequent network vs status quo network. Graphic courtesy Auckland Transport
The figure of the New Network shows the difference between the amount of frequent service that Auckland can provide on a connective network (on the left) – with services at least every 15 minutes, 7am-7pm, 7 days a week – and the level of frequent service we would have been able to provide if we had continued the status quo of the one-seat ride network (on the right). Clearly this is a significant increase in the size and geographical reach of the frequent transit network. One key element of this frequent transit grid is a strong network of cross-town connections to fill it out, particularly to meet key cross-regional travel flows that don’t pass through downtown. Transit agencies use metrics to assess their performance and should be related to their service goals; however, transit metrics can either drive you the right way or the wrong way. For example, there may be a metric measuring the percentage of people within 500 metres of a bus stop. This bus stop may only have one or two trips a day whereas other bus stops may have frequent service 18 hours a day. Hence, it’s a metric of some extremely basic (& highly variable) level of transit accessibility. A better metric is to measure how much of the city or how many destinations a person has access to within a certain number of minutes travel time (e.g., 15 minutes or 30 minutes including walking and connections). Clearly, transit planning is not, as might be the case in the popular imagination, drawing lines on maps. It is a exercise of very considerable complexity carried out in a framework of principles that should be as simple as they are intuitive. There are crucial choices and trade-offs to be made as funding is limited and it is crucial when making these choices to be explicit about what you are trading off and what the benefits of the choices are. And it is important to realize that if you are choosing one thing – for example one-seat rides as a priority – then you are choosing to miss out on the power of connective networks to deliver the freedom of the city to all transit customers, including those on the coverage network. Halifax has many of the key prerequisites already in place to make transit work even better. Here’s hoping Halifax grasps the opportunity presented by Moving Forward Together to make a transformational shift in its public transit network, delivering much better service to customers and much better value for the money invested in supporting transit service. Disclaimer: The author of the above post is an employee of Auckland Transport, however, the views, or opinions expressed in this post are personal to the author and do not necessarily represent the views of Auckland Transport, its management or employees. Auckland Transport is not responsible for, and disclaims any and all liability for the content of the article.


